

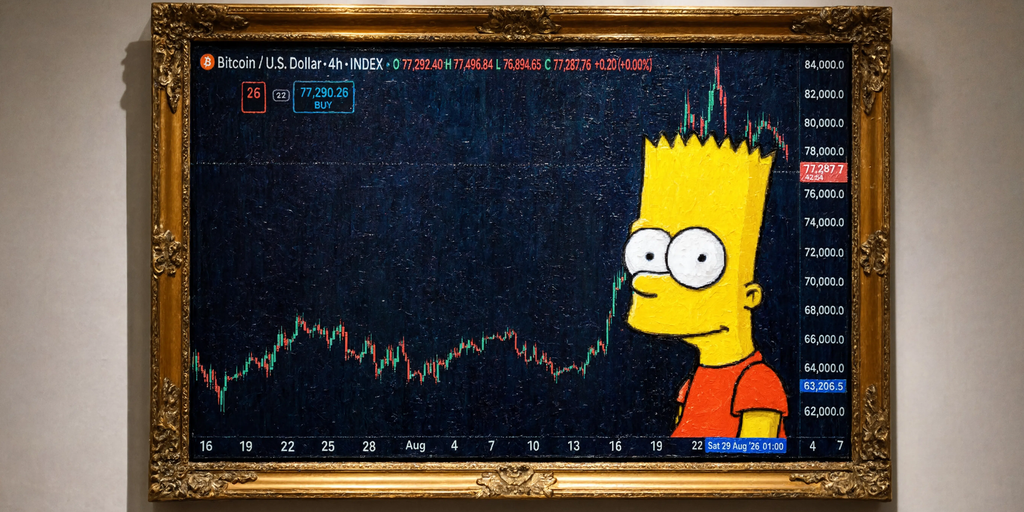
The Specter of the 'Bart Simpson' Pattern: Unpacking Bitcoin's Volatility and the Anatomy of a Flash Crash
The unpredictable volatility of the cryptocurrency market continuously presents investors with formidable challenges. A recent analysis from Decrypt delved into the potential emergence of the so-called 'Bart Simpson' pattern in Bitcoin's price charts—a scenario characterized by a rapid ascent, followed by consolidation, and then a sharp decline. This pattern, far from being a mere technical anomaly, signals potential risks stemming from deep-seated liquidity issues, investor psychology, and complex macroeconomic factors. This essay aims to dissect the essence of such a potential flash crash and explore how investors can prudently navigate an inherently uncertain market landscape.
The Enigmatic 'Bart Simpson' Pattern: A Technical Mirage?
In the lexicon of cryptocurrency trading, the 'Bart Simpson' pattern is an informal term describing a specific price movement. It refers to an asset, such as Bitcoin (BTC), experiencing a rapid price surge, followed by a period of relatively flat consolidation, and then a sharp decline, creating a chart formation reminiscent of the cartoon character Bart Simpson's head. As reported by Decrypt on September 2, 2026, such patterns are often interpreted as the result of market manipulation or large-scale trading activities by specific entities. However, for this pattern to genuinely materialize, it requires a confluence of complex market conditions beyond mere chart aesthetics. It's a scenario that can only become reality when market liquidity, the impact of large orders, and the collective psychology of investors converge.
Anatomy of a Flash Crash: Beyond the Chart
Liquidity and Order Book Dynamics
For a flash crash, akin to the 'Bart Simpson' pattern, to occur in the Bitcoin market, the state of market liquidity is paramount. In situations with thin order books—where there aren't sufficient buy or sell orders at specific price levels—even relatively small trades can trigger significant price movements. If a large market order enters a segment with insufficient liquidity, it can initiate a cascade of price changes, precipitating a rapid decline. Decrypt underscores that such liquidity vulnerability is a critical prerequisite for a flash crash.
Macroeconomic Headwinds and Catalysts
Technical patterns alone are insufficient to explain market movements. The Bitcoin market is increasingly intertwined with traditional financial markets, and macroeconomic factors exert a growing influence on prices. Global inflationary pressures, shifts in central bank interest rate policies, major regulatory announcements concerning cryptocurrencies, or unforeseen geopolitical events can all serve as powerful catalysts, rapidly eroding investor confidence and triggering widespread selling. Such external shocks can accelerate or deepen the downward leg of a 'Bart Simpson' pattern.
The Role of Derivatives and Leveraged Positions
Another distinguishing feature of the cryptocurrency market is the active trading of highly leveraged derivatives. Should prices fall below a certain threshold, forced liquidations occur, adding further selling pressure. These cascading liquidations amplify market downturns, leading to 'long squeezes' that can drive prices down at an unpredictable pace. This internal mechanism can play a decisive role in shaping the sharp decline phase of a 'Bart Simpson' pattern.
Investor Sentiment and Market Psychology
Ultimately, the market is a mirror reflecting investor sentiment. Abrupt price swings, like those in a 'Bart Simpson' pattern, amplify fundamental human emotions of fear and greed. During rapid ascents, FOMO (Fear Of Missing Out) often drives speculative buying, while during sharp declines, panic selling ensues, further exacerbating market volatility. Such crowd psychology can sometimes override rational analysis, causing technical patterns to act as self-fulfilling prophecies.
Navigating the Volatility: A Prudent Approach
Given the inherent volatility and potential flash crash risks in the Bitcoin market, investors must exercise extreme caution. Rather than relying solely on short-term chart patterns, it is crucial to comprehensively analyze the market's underlying liquidity, macroeconomic trends, and the dynamics of the derivatives market. Risk management is essential, and investors should formulate strategies that align with their investment goals and risk tolerance, alongside diversification. If you need the latest financial market trends and professional analysis, expand your investment insight by checking Market Insight and key asset technical charts on FireMarkets. Only such a holistic approach will pave the way for sustainable success in the unpredictable cryptocurrency market.
FireMarkets Intelligent Outlook
Real-time technical analysis and AI sentiment for BTC.
View AI Analysis Summary
Crypto Fear & Greed
Next Update: Unknown
Firemarkets.net AI Analysis Result:
* Not financial advice. Data for informational purposes only.
Want deeper analysis on this asset?
Check out expert reports and on-chain data provided by FireMarkets specialists.
All content provided by FireMarkets (including news, analysis, and data) is for reference purposes only to assist in investment decisions and does not constitute a recommendation to buy or sell any specific asset.
Financial markets are highly volatile, and past performance is not indicative of future results. Please rely on your own judgment and consult with professionals before making any investment decisions. FireMarkets assumes no legal liability for investment outcomes.